

How to use a spectrogram for emissions investigations
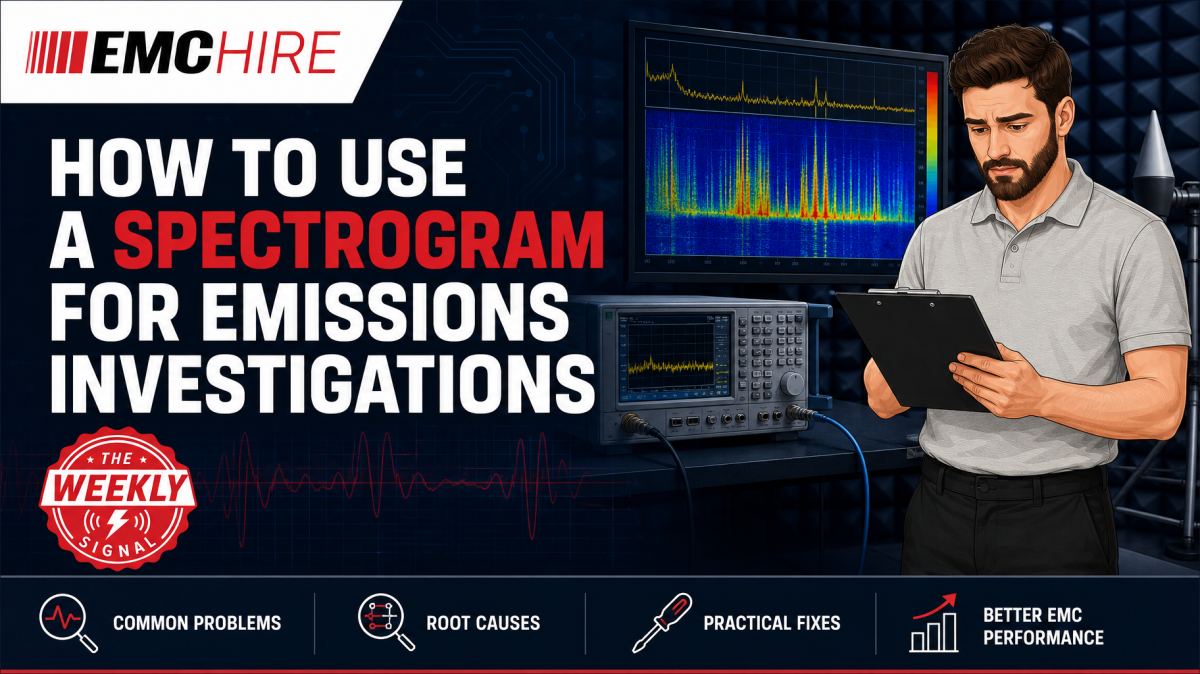
A conventional emissions trace shows amplitude against frequency at one moment. A spectrogram exposes what happened between sweeps, often revealing the switching event, operating mode or intermittent transmission responsible for a failure.
What a spectrogram adds to emissions testing
A spectrogram is a time-resolved representation of a frequency spectrum. Frequency normally appears on the horizontal axis, elapsed time on the vertical axis and signal amplitude as colour. Depending on the instrument, the newest data may appear at the top or bottom, so the time direction must be checked before interpreting a sequence.
The display is also called a waterfall, although the terms are not always implemented identically. Some instruments use waterfall for a three-dimensional stack of traces and spectrogram for a two-dimensional colour map. Both formats retain time information that is lost when a receiver simply stores a maximum-hold trace.
That distinction matters in EMC investigations. A maximum-hold result tells you that energy occurred at a frequency, but not whether it was continuous, periodic, associated with start-up or present for only a few milliseconds. A spectrogram can distinguish those behaviours and direct the engineer towards the physical source.
It is primarily a diagnostic tool. Unless the applicable standard or test plan explicitly provides otherwise, a spectrogram does not replace the prescribed emissions measurement using the required detector, resolution bandwidth, measurement distance, transducer and EUT configuration.
How to read the display
Continuous narrowband lines
A vertical line at a fixed frequency usually indicates a persistent narrowband source. Common candidates include oscillators, clock fundamentals, clock harmonics, local oscillators and stable switch-mode converter components. If several equally spaced lines move together when a clock frequency changes, the spacing often identifies the underlying repetition frequency.
Do not assume every stable line comes from the EUT. Broadcast services, mobile transmissions, chamber electronics and nearby digital equipment can produce similar features. Record an ambient spectrogram with the EUT switched off, while retaining the same antenna, receiver settings and physical arrangement. Otherwise, an ambient comparison may be meaningless.
Horizontal bands and short-duration events
With frequency on the horizontal axis and time on the vertical axis, a short broadband event appears as a horizontal stripe. Relay operation, motor commutation, load switching, arcing and processor state changes can generate this pattern. A dense sequence of stripes may look like a continuous noise floor if the time resolution is too slow.
Transient emissions require careful interpretation. The apparent duration depends on sweep time, FFT update rate, overlap, persistence and resolution bandwidth. A stripe occupying three display rows does not automatically mean that the physical disturbance lasted for three complete update periods. The instrument's processing may spread or combine the event.
Frequency drift and curved tracks
A diagonal or curved feature indicates changing frequency. That may result from thermal drift, frequency hopping, spread-spectrum clocking, converter control-loop behaviour or a variable-speed drive changing operating point. Correlating the track with temperature, load, motor speed or firmware state is usually more productive than examining its absolute amplitude first.
Spread-spectrum modulation deserves particular care. It can reduce the amplitude seen in an individual frequency bin by distributing energy across a wider range, but it does not necessarily reduce total emitted energy or guarantee a lower result with the detector and bandwidth required by the applicable standard.
Repeating patterns
Regularly repeated bursts often point to polling intervals, wireless beacons, display refresh activity, housekeeping tasks or burst-mode power conversion. Measure the repetition period with the spectrogram time scale, then compare it with firmware logs, oscilloscope captures or known operating cycles.
Correlation is stronger than visual resemblance. If changing a software interval causes the emissions pattern to change by the same ratio, the investigation has moved from speculation towards a defensible source identification.
Configuring a useful spectrogram
Start with the engineering question
Instrument settings should follow the problem. A broad frequency span is useful for locating unknown activity but normally reduces time resolution, frequency detail or both. Once a suspect band has been identified, narrowing the span generally improves the ability to resolve timing and modulation.
For conducted emissions on a relevant power port, use the LISN and measurement arrangement required by the applicable product or product-family standard. Conducted disturbance voltage is commonly investigated over 150 kHz to 30 MHz, but that range is not universal. For radiated emissions, use an appropriate antenna and preserve the relevant geometry. Radiated measurements commonly begin at 30 MHz, although the upper frequency, distance and method depend on the product and applicable requirements.
Resolution bandwidth changes what is visible
Resolution bandwidth affects displayed amplitude, noise floor, frequency discrimination and measurement time. A narrower bandwidth may separate adjacent spectral components but can miss or visually distort short events when the update rate becomes too slow. A wider bandwidth captures more energy and may improve time response, while merging components that need to be distinguished.
Use exploratory settings during diagnosis, then return to the bandwidth and detector specified by the relevant emissions method when assessing margin against a limit. CISPR measurements commonly use peak scanning followed by quasi-peak or average measurements where required, but the correct detector and bandwidth depend on frequency range and the applicable standard. A fast FFT spectrogram with a peak-like display must not be presented as though it were a compliant quasi-peak measurement.
Set the colour scale deliberately
An automatic colour scale can make a weak feature look dramatic or cause an intermittent signal to disappear after a stronger event. Set the reference level, attenuation, preamplifier state and colour range so that the receiver remains linear and the relevant amplitude region is visible.
Overload is particularly misleading. Strong out-of-band signals can create intermodulation products, raised noise floors or false broadband activity. Increase attenuation, remove unnecessary preamplification or apply suitable filtering, then check whether the suspect features remain. If they vanish disproportionately, the display may have been showing receiver-generated artefacts rather than EUT emissions.
Preserve enough time history
The observation window must cover the EUT's real operating cycle. A 20-second capture tells little about equipment that performs a high-current task every five minutes. Conversely, a long recording with poor time resolution may obscure individual events.
Triggering can help isolate start-up, transmission, actuator operation or load changes. Where the analyser supports external or level triggering, record the trigger source and delay. Without those details, another engineer may be unable to reproduce the relationship between the spectrogram and the EUT event.
Real-time spectrum analysis can reduce the probability of missing short or infrequent signals, provided the selected span, analysis bandwidth and probability-of-intercept performance suit the event. The Narda SignalShark 3310 is an example of equipment that may support time-dependent spectrum investigations. For standards-oriented emissions work, an instrument such as the Rohde & Schwarz ESR7 EMI test receiver and analyser combines diagnostic analysis with EMI receiver functions. Suitability still depends on frequency coverage, required detectors, bandwidths, dynamic range and the relevant test method.
Engineers wanting a visual introduction to this type of display can also review this spectrogram demonstration video. Instrument-specific controls vary, so the operating manual remains the reference for acquisition and display behaviour.
Linking the pattern to the hardware
A spectrogram is most productive when combined with controlled changes. Alter one variable at a time: operating mode, processor clock, converter load, cable position, peripheral state or communications interval. Capture before-and-after displays using identical receiver settings.
Near-field probes can then localise suspect circuitry, although their readings are comparative and highly sensitive to probe position and orientation. A current probe around a cable can show whether a time-correlated disturbance is flowing as common-mode current. Neither measurement directly substitutes for the prescribed conducted or radiated emissions result.
Time-domain monitoring helps as well. A current clamp connected to an oscilloscope may show that a broadband stripe aligns with a motor drive edge or relay event. Maintain electrical safety, loading and bandwidth discipline. An inappropriate probe connection can alter the return path or expose the operator and equipment to hazardous voltages.
Typical scenario
Consider an illustrative industrial controller that produces an intermittent radiated peak during emissions testing. A conventional swept trace catches the peak inconsistently. Repeating the sweep changes its apparent amplitude, making cable experiments difficult to compare.
The engineering team configures a spectrogram around the suspect band using the test antenna and a repeatable EUT arrangement. The display shows a narrowband burst every time an Ethernet-controlled actuator changes state. Firmware logging confirms the timing, while a current probe indicates a simultaneous rise in common-mode cable current.
The team must decide whether the source is internal clock activity, actuator switching, cable conversion or a receiver artefact. Narrowing the span, checking for overload, recording an ambient capture and repeating the test with controlled actuator timing separates these possibilities. Cable rerouting without documentation would be risky because an apparent improvement might simply result from changing antenna coupling.
Investigating this behaviour before formal testing gives the designers room to evaluate bonding, filtering, shielding and interface layout without paying for repeated late-stage test slots. EMC Hire can support the work through equipment hire, pre-compliance measurements, test facility access or on-site investigation. Formal compliance testing can then be planned around the product-specific standard and representative operating modes.
Equipment used for quantitative measurements should have suitable calibration. EMC Hire uses test equipment with calibration traceable through an appropriate ISO/IEC 17025 accredited calibration provider. This supports repeatability, comparison between development and formal measurements, and a stronger evidence trail. It does not turn a diagnostic spectrogram into automatic proof of compliance.
When to Hire EMC Equipment
Spectrogram investigations often arise during a short debugging window rather than as a continuous laboratory requirement. Hiring can provide access to a receiver or real-time analyser with the necessary frequency coverage, dynamic range and recording capability without committing capital to equipment that may not suit the next programme.
It also avoids long-term storage, maintenance, servicing and calibration overheads. This is relevant where project demand is irregular or several development teams need instruments simultaneously during a compliance peak.
Selection still needs engineering scrutiny. A spectrum analyser may offer an attractive waterfall display but lack the CISPR detectors, specified bandwidths or overload performance needed for standards-oriented emissions testing. Hiring the wrong instrument saves no time. EMC Hire can help define the required span, receiver functions, transducers and test window, then support on-site work, pre-compliance analysis or a facility booking.
Common EMC Testing Mistakes to Avoid
Treating colour as an absolute measurement
Colour depends on the selected scale, attenuation and processing. Comparing screenshots with different settings can produce a false improvement. Save numerical data and acquisition settings alongside the image.
Using maximum hold as a substitute for timing
Maximum hold removes event chronology. It can combine unrelated disturbances into one alarming trace and conceal whether they occurred in the same operating state.
Changing cable geometry between captures
Cables are often dominant radiating structures. Moving one while changing firmware or filtering introduces a second variable, making the diagnosis inconclusive and reducing repeatability.
Ignoring receiver overload and ambient signals
Overload products can resemble real broadband emissions, while ambient transmitters can be mistaken for EUT activity. Attenuation checks and EUT-off recordings should form part of the investigation.
Testing an unrepresentative operating mode
An idle spectrogram may look clean while communications, motor loads or display activity create the limiting emissions. The test plan should define operating modes, software version, loads, accessories and event timing.
Failing to preserve acquisition details
A screenshot without span, bandwidth, detector or FFT processing, attenuation, preamplifier state and time scale has limited evidential value. Record antenna or LISN configuration, cable positions, EUT state and timestamps as well.
Frequently Asked Questions (FAQs)
Can a spectrogram be used directly for compliance measurements?
Usually it is used for investigation rather than as a replacement for the prescribed measurement. Compliance assessment must follow the applicable product or product-family standard, including detector, bandwidth, transducer, geometry, operating mode and limit requirements.
Is a real-time spectrum analyser always better than an EMI receiver?
No. Real-time analysis can be better for capturing intermittent behaviour, while an EMI receiver may provide the detectors, bandwidths and measurement functions required for formal emissions work. Some instruments combine both capabilities. Selection should follow the investigation and compliance requirements.
Why does an emission disappear when the span is widened?
The analyser may have reduced time resolution, FFT resolution, update rate or displayed frequency detail. The event may still be present but occupy too few pixels or occur between acquisitions. Overload behaviour and automatic attenuation changes should also be checked.
Should I use peak, quasi-peak or average detection?
Peak detection is useful for rapid searching and conservative prescans. Quasi-peak and average detectors are used where required by the applicable emissions standard. Their results cannot reliably be inferred from spectrogram colour alone.
What evidence should be retained from an investigation?
Keep raw traces where available, screenshots, receiver settings, calibration status, transducer details, cable photographs, ambient records, EUT operating modes, software revisions and event logs. This material can support the technical file, mitigation evidence and later formal testing.
Does passing pre-compliance testing prove conformity?
No. Pre-compliance work improves engineering confidence and can provide calibrated data for self-certification decisions where legally and technically appropriate, but it does not automatically demonstrate that every applicable requirement has been met. The manufacturer remains responsible for confirming legislation, standards, editions, test levels, configurations, limits, documentation and the conformity assessment route.
Planning the next investigation
Before booking equipment or test time, define the suspect frequency range, event duration, EUT cycle, required transducers and whether the objective is diagnosis, pre-compliance or formal compliance testing. Check the latest active edition of each relevant standard and any customer-specific test plan. Defence, automotive and aerospace programmes may also require final testing by an appropriately accredited laboratory, depending on contractual or programme requirements.
EMC Hire can help with instrument selection, equipment hire, pre-compliance engineering, formal compliance testing where appropriate, on-site testing and access to an EMC test facility. To discuss a spectrogram investigation, request a hire quotation or book test time, contact the engineering team on +44 (0)1462 817111 or email sales@emchire.co.uk.
Disclaimer: Content is for informational purposes only and does not constitute formal engineering or regulatory advice. Always verify testing procedures against current official standards (e.g., ISO, MIL-STD, DEF STAN). EMC Hire Limited accepts no liability for outcomes resulting from the use of this information.